
Current Data
Use the following links to view some of the data collected over the previous week, and click on the graphs to see larger versions. The data is updated 4 times a day, so please refresh if a cached image appears.
|
Daily Weather |
Daily Atmospheric |
Daily Soil |
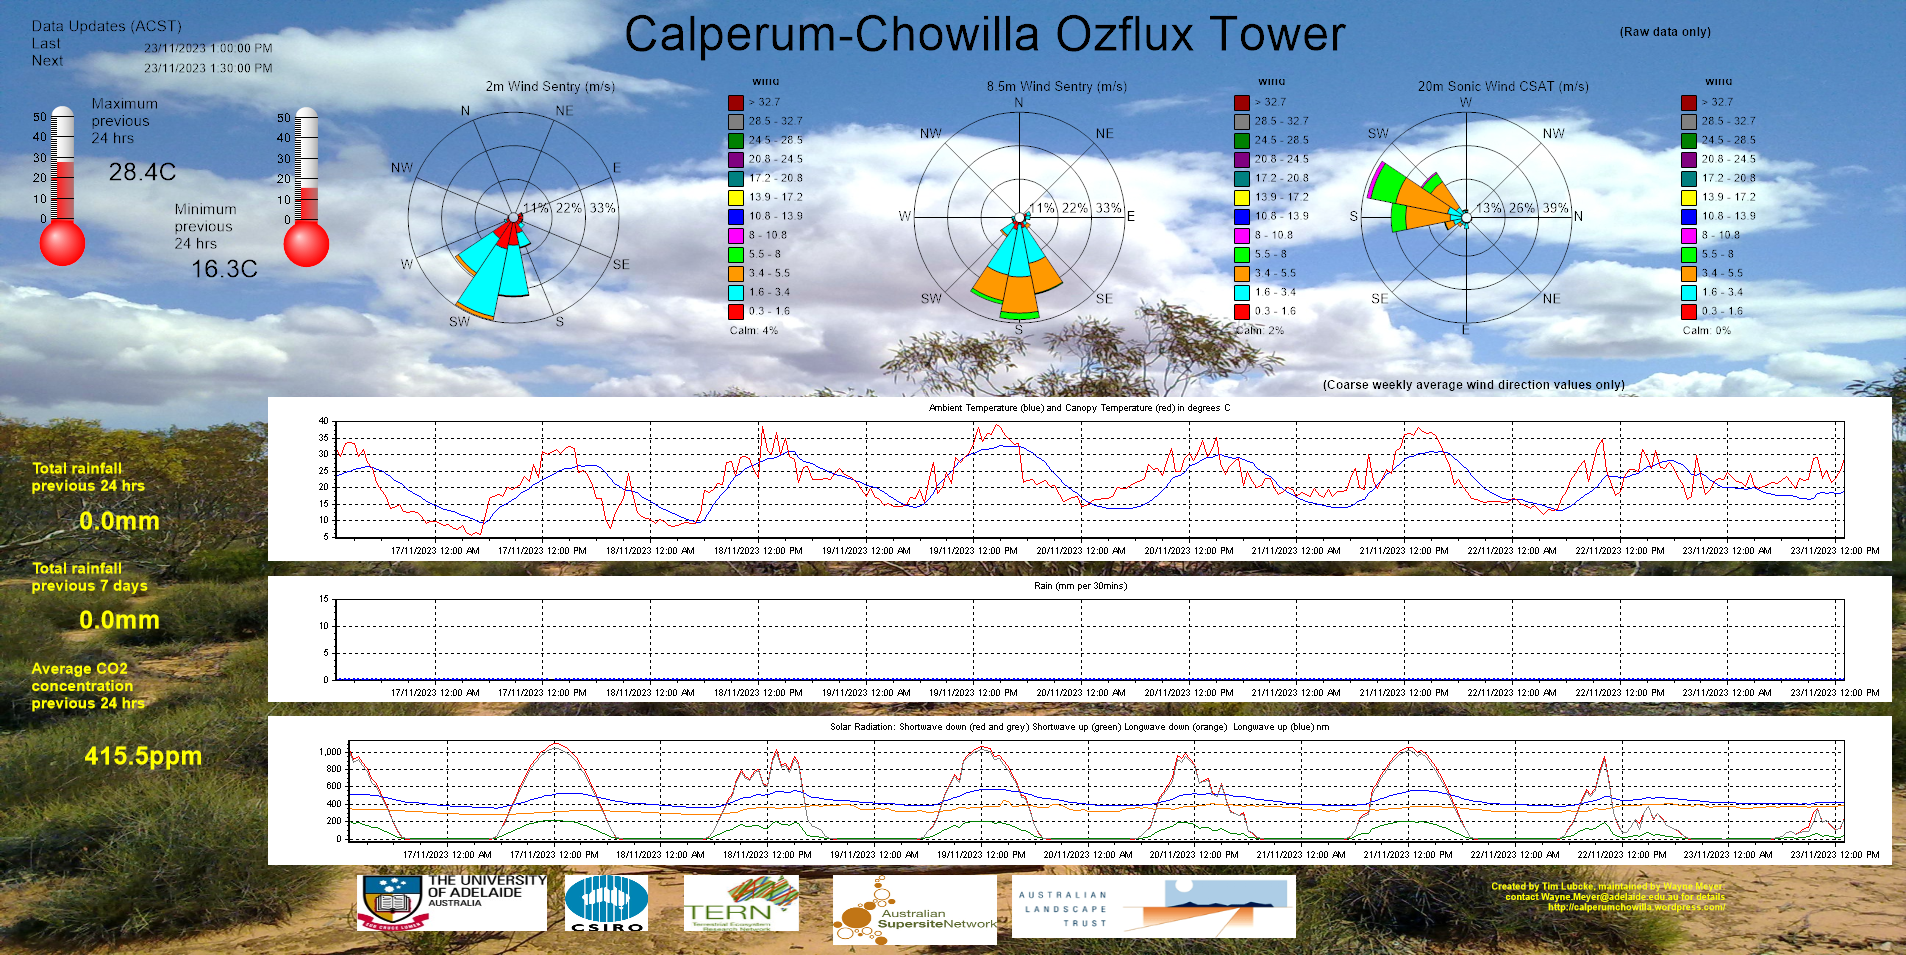
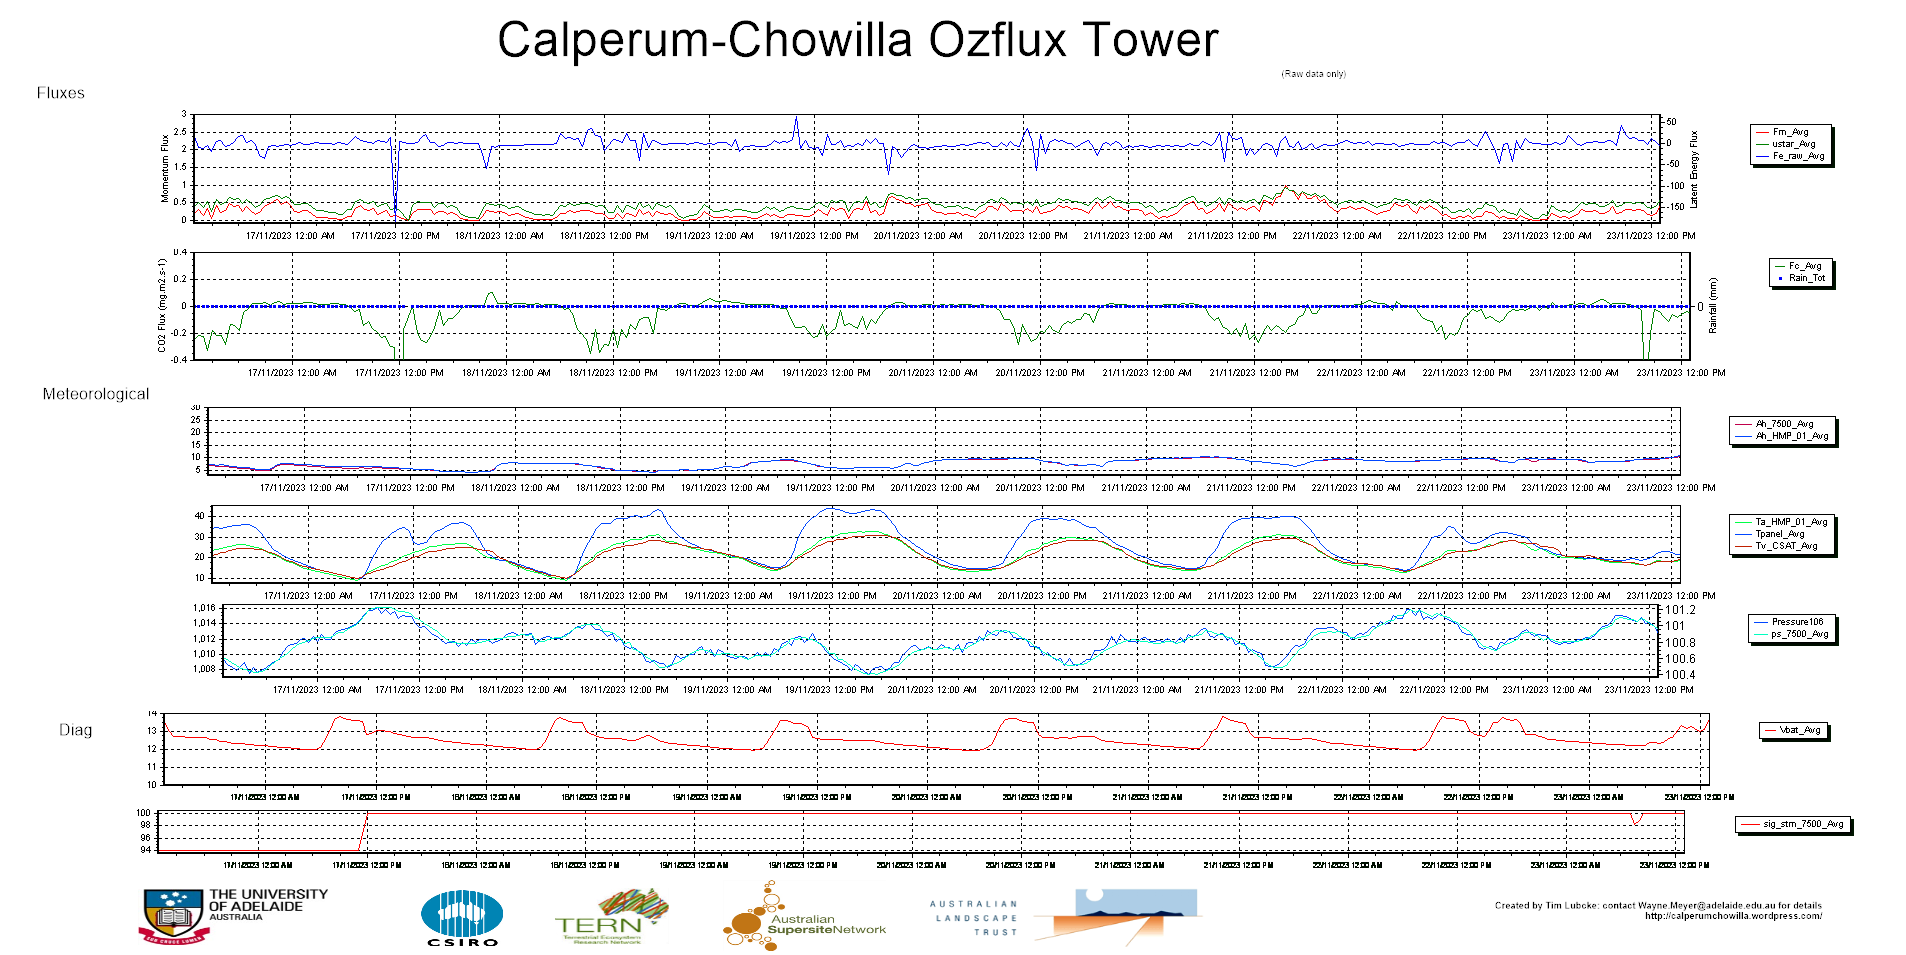
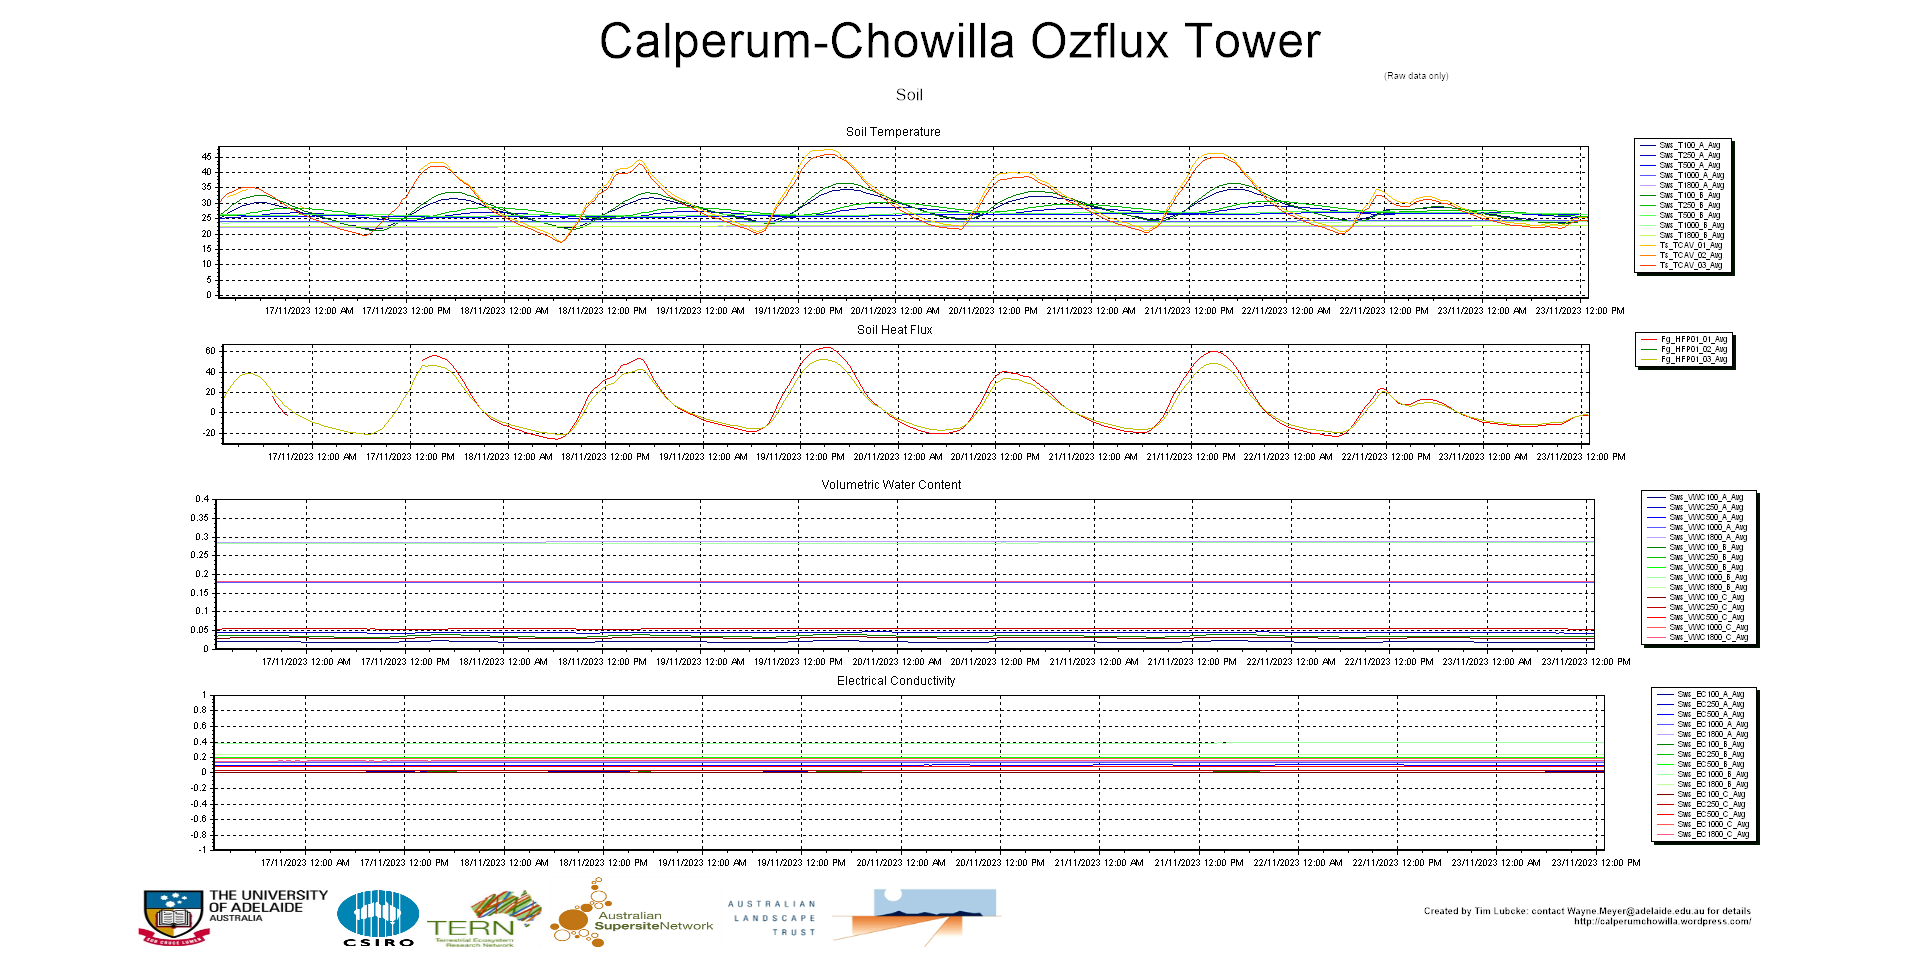
For an explanation of the graphs and their Legends, please see Graphs: Legends & Explanations.
Data Management
The flux recorders collect data ten times per second (10 Hertz), requiring major data storage, transmission and analytical capabilities. To begin with, the data are packaged into thirty minute sets, with averages and totals determined. Every six hours the data is downloaded from the site to the University of Adelaide, with updates to the data on this website. Researchers can also connect remotely to the on-site data logger at any time.
 The water and carbon dioxide flux gear |
 The solar radiant energy instruments. |
Data library
Data from the Calperum Site is available via the OzFlux Data Portal, subject to copyright and acknowledgement provisos.