
Rainfall
Rainfall is a driving force in the mallee ecosystem at Calperum. Along with temperature, it influences respiration, CO2 levels and net productivity (the amount of vegetative dry matter produced).
CO2 levels
Data from a two year period (August 2010 – August 2012) shows that atmospheric CO2 concentrations tend to increase after rainfall.
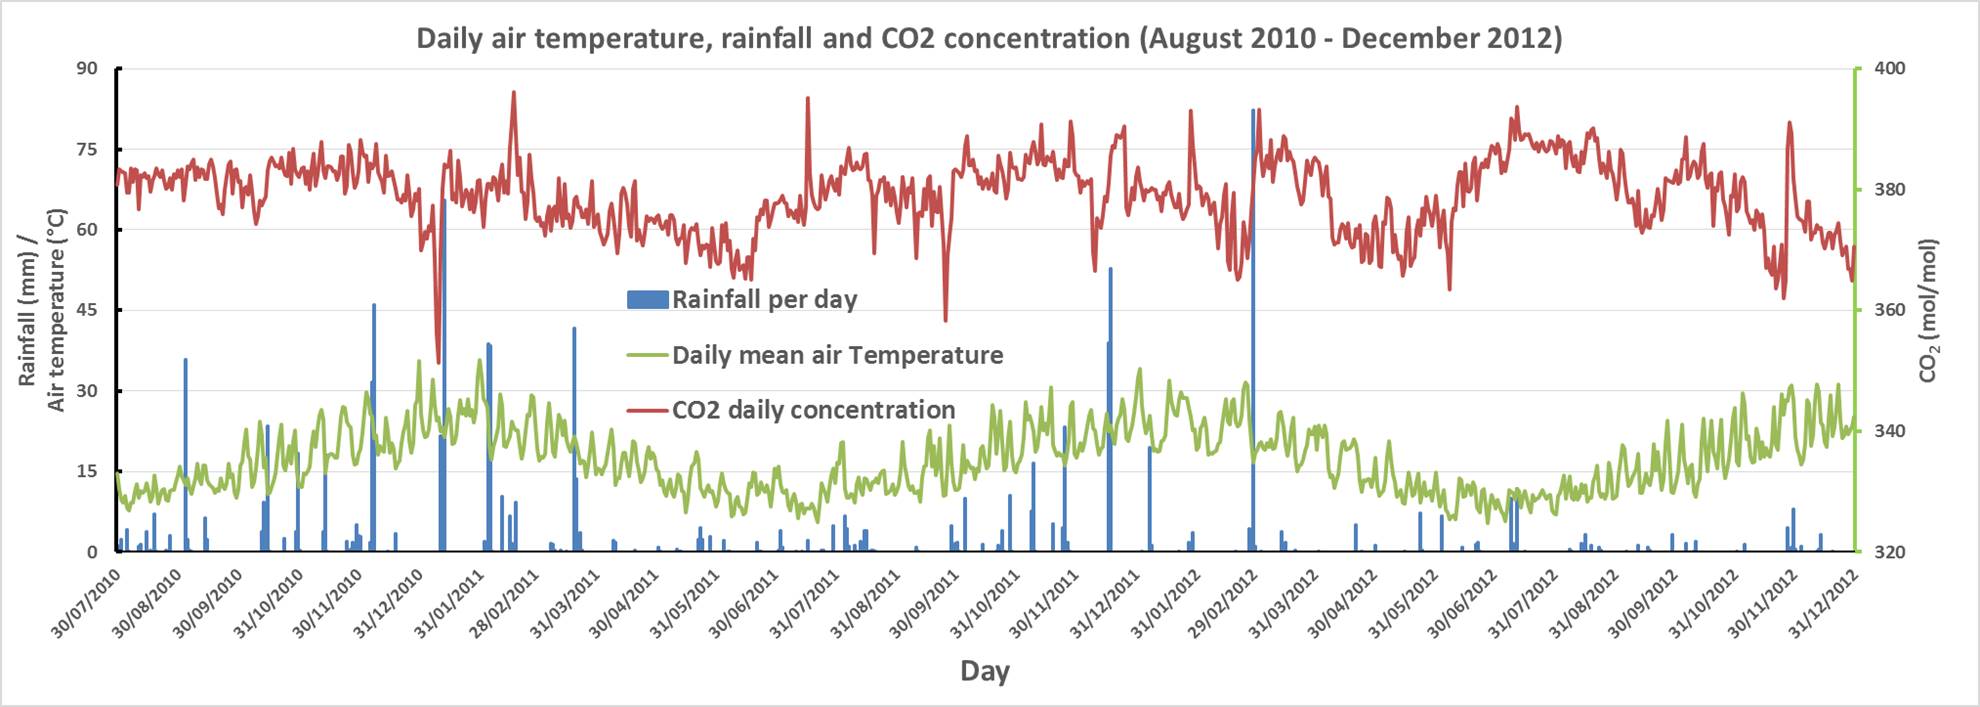
- The seasonal pattern of temperature is clearly evident over this two year period.
- This was a wetter period from August 2010 until February 2012. It followed a substantial dry period between 2002 and 2010. The main rainfall occurred during the summer period, with only smaller rainfall during autumn and winter.
- The concentration of CO2 in the atmosphere shows typical daily variation, mostly between 370 to 390 ppm (or mol/mol)
- As a general observation wetter periods are followed by higher CO2 concentrations. Drier periods tend to cause lower CO2 concentrations.
- These trends result from the interplay between the uptake of CO2 by the green vegetation and the production of CO2 by respiration of the soil and plants. Both processes are affected by available water and temperature.
Soil respiration
Soil respiration, resulting in a loss of carbon from the ecosystem back into the atmosphere, is very sensitive to rainfall.

- Generally soil respiration increases immediately after rain - especially after a prolonged dry period. Even a small amount of rain following a dry period will trigger significant soil respiration.
- After periods of rainfall that keep the top soil moist, soil respiration rates still respond to additional rain, but much less actively.
It is known from other studies that the majority of the energy source for soil microbes, and hence soil respiration, comes from the carbon that is exuded by the roots. It is estimated that up to half of the carbon fixed by the green leaves of plants is transported to the roots. That carbon is then either respired by the roots (to support their growth and maintenance), or is exuded by the roots.
Exudate from roots encourages the growth of microbes in the soil immediately surrounding the root (the “rhizosphere”). In turn, the healthy microbial activity makes the tiny amounts of essential nutrients, which are usually bound on soil particles, more available to be absorbed by the roots. In essence, the plant is “feeding” the microbes to help produce an environment around the root that supplies the essential nutrients the plant needs. These respiration processes produce CO2.
Net Ecosystem Productivity
Net Ecosystem Productivity (NEP) is calculated from the measured half hourly exchanges of CO2, from which the difference between the daily uptake of CO2 by the green vegetation and the production of CO2 by respiration is estimated. NEP is positive if the ecosystem is gaining (sequestering) carbon. During the two year period (August 2010 – August 2012) sequestration was occurring most of the time.
- During extended drier periods the net carbon uptake gradually declines and may become negative; i.e. there is a net loss of carbon - such as occurred towards the end of 2012, after 9 months of low rainfall.
- Following rainfall in the last 4 months of 2010, the ecosystem accumulated carbon during 2011 and 2012. With lower rainfall in 2012 and median rainfall in 2013, carbon accumulation slowed in 2013.

It is clear that the vegetation, particularly the evergreen Mallee trees, is very well attuned to the availability of water. The Mallee has evolved to grow and survive in this environment of limited and variable rainfall.
- When there has been good rainfall and the soil water status is high the trees will gradually grow more leaves. The response is slow, usually over a period of 2 to 3 months.
- When rainfall is limited and soil water status is declining (i.e. the soil root zone is drying) the trees adapt by gradually slowing evapotranspiration, slowing growth, and eventually losing green leaves.
The period from August 2010 to December 2016 has been a period of average to above average rainfall. A bushfire in January 2014 resulted in a net loss of carbon, followed by a slow recovery as the plants (mainly mallee trees) grew new shoots. See Fire for more information.
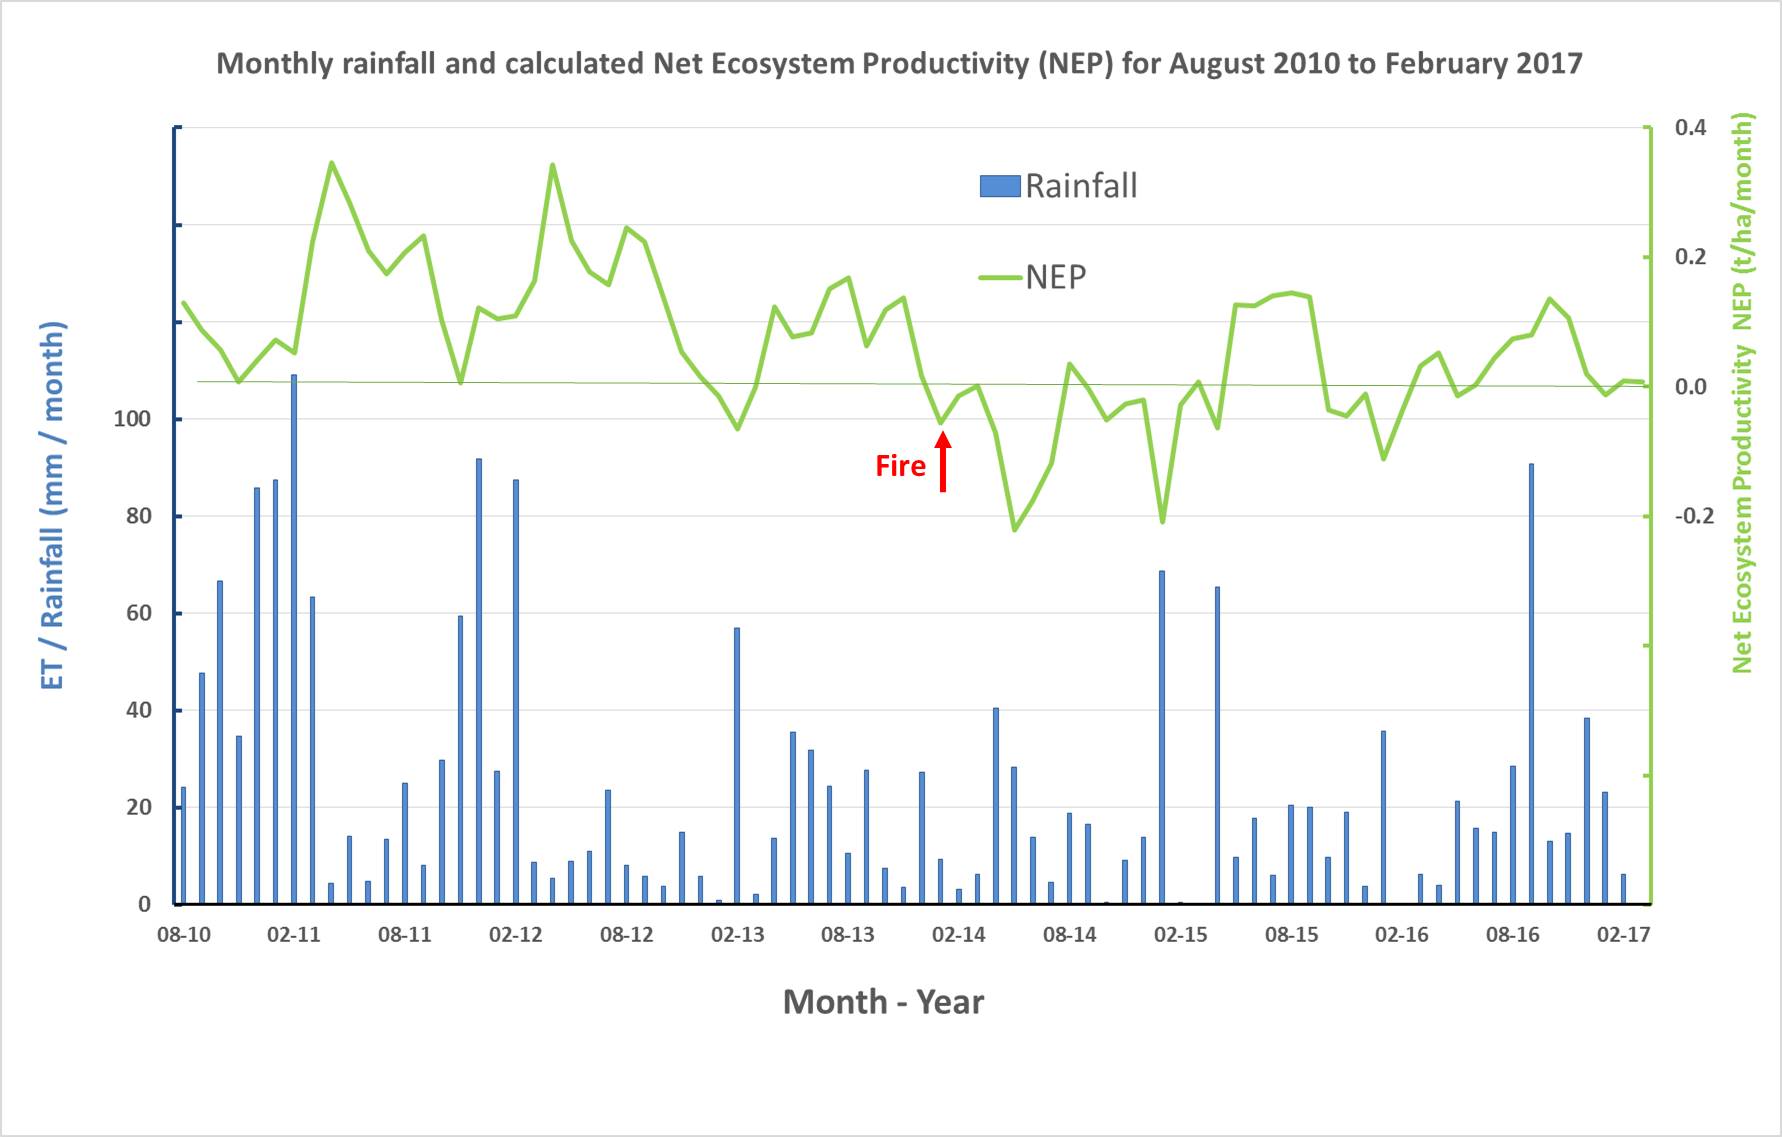
Net ecosystem productivity is highly dependent on rainfall. The vegetation grows and accumulates (sequesters) carbon after rainfall - but when there is limited rainfall, e.g. April 2012 to February 2013, NEP declines to such an extent that the vegetation system is actually losing carbon.
Carbon Sequestration
In natural ecosystems carbon sequestration (by photosynthesis in green leaves) and concomitant loss of carbon by respiration, are the only sources of carbon inputs and outputs. Over a long period NEP, that is the difference between sequestration and respiration, therefore indicates whether the ecosystem has a net gain or loss of carbon.

There is a very clear relationship between rainfall and carbon accumulation of the ecosystem.
- After periods of high rainfall (e.g. more than 500mm in 2011, with compared with the median annual rainfall of 242 mm), the ecosystem grows and accumulates carbon (C) at about 2 t C/ha/yr.
- In years of median rainfall the rate of accumulation is less than 1 t C/ha/yr.
- In dry years there is very little accumulation of carbon, and in very dry years there is likely to be a net loss.
- Since August 2010 the average carbon accumulation has been about 0.6 t C/ha/yr. However this measurement period has been wetter than might be expected in the long term. The long term accumulation rate, including extended dry periods, would probably be lower - more like 0.3 t C/ha/yr.
Fire
Leaf Area Index
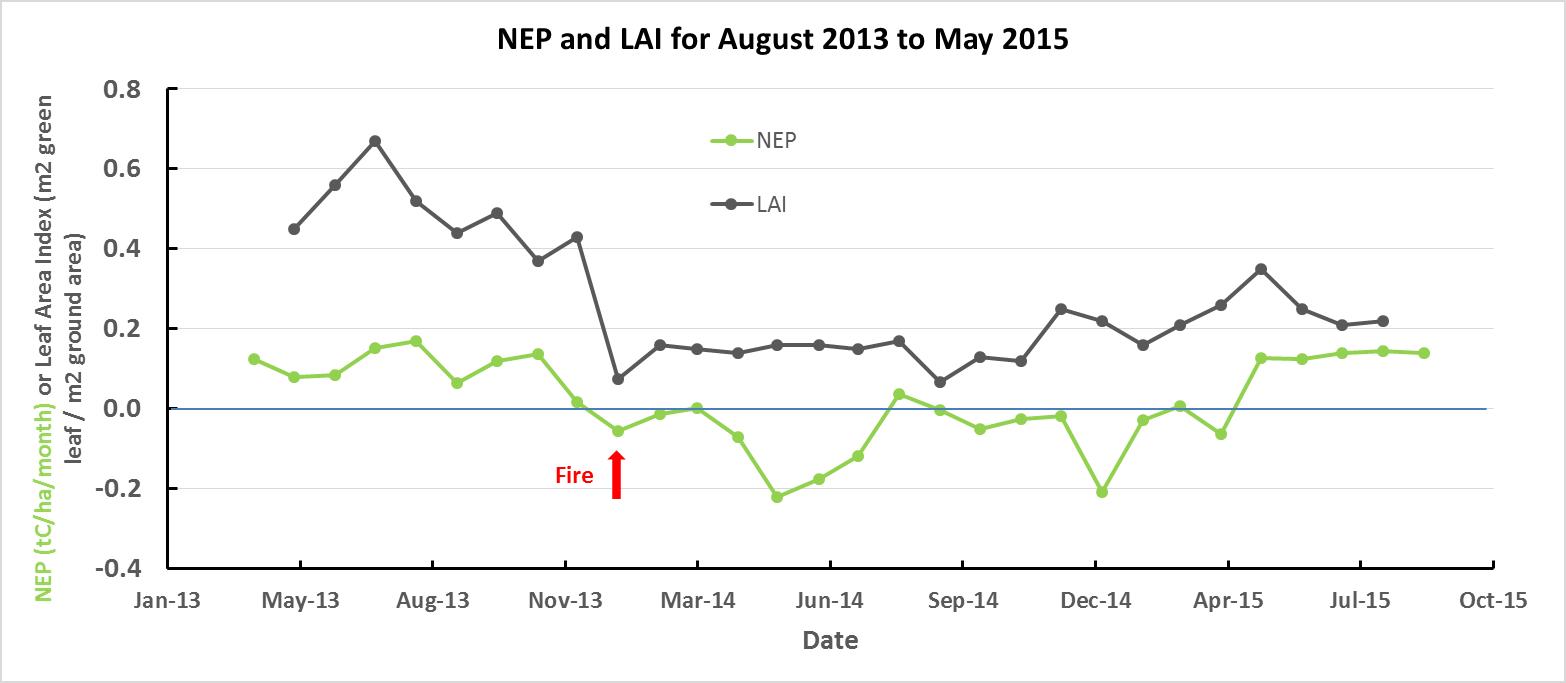
There is a close relationship between the amount (or area) of green leaves and the net productivity of the ecosystem, shown in the Figure below.
- As the ecosystem was drying (July 2013 to January 2014) the leaf area index (LAI) and NEP were also declining. The fire in January 2014 caused the loss of almost all leaves and the LAI remained at about 0.1 until November 2014.
- After that lag-time, the LAI started to increase - but NEP lagged further, and took until May 2015 before becoming positive.
Net Ecosystem Productivity
As shown in the Net Ecosystem Productivity graphs above, after a bushfire in January 2014 there was no net ‘growth’ for some time. In fact the ecosystem continued to lose carbon until May 2015 – a lag of16 months after the fire. By this time the Mallee trees had regrown from the lignotubers (the Mallee roots), but not the unburnt trunks (see below). Some grasses and shrubs had also grown.
Carbon Sequestration
The frequency of fire at Calperum seems to be in the range of once every 20 to 30 years. In the period between fires there is opportunity for the ecosystem to accumulate dry matter and carbon, with the trunks and lignotuber of the mallee trees being the major store of carbon. In those intervals between fires several extended dry periods would be expected to occur, resulting in very small, or negative, amounts of carbon accumulation.
Our measurements indicate that the rate of carbon accumulation varies considerably between years, with rates from -1 t C/ha/yr in dry years to 2t C/ha/yr in the occasional wet years.
Measurements of above ground dry matter indicate that the mallee trees had 9.3 t/ha at the time of the fire in January 2014 - which had accumulated over a period of nearly 30 years. That implies a longer term rate of carbon accumulation of about 0.3 t C/ha/yr.
The standing biomass was measured before and after the fire, and is shown in the following table; ‘Calperum DM’.
| Calperum dry matter(DM) and total carbon C loss | |||
| Pre-Fire DM (t/ha) | Post-Fire DM (t/ha) | C loss in Fire (t/ha) | |
| Trunks | 7.2 | 7.1* | |
| Branches | 1.1 | 0.1 | |
| Leaves | 1.1 | 0.1 | |
| Litter & Grasses | 1.0 | 0.0 | |
| Total | 10.4 | 7.3 | 1.55 |
- The trunks of the multi-stemmed mallee were killed by the fire. The thin outer bark was burned but the dead woody trunks remain. These trunks will gradually be felled by termites and will be broken down over the next 15 to 20 years.
For comparison, the average carbon accumulation of a tropical savanna grassland ecosystem in northern Australia (Howard Springs) was 4.2 t C/ha/yr with rainfall of ~1500mm (Beringer et al. 2016).
The relatively infrequent fires at Calperum contrasts with the near annual fires in the savanna areas of northern Australia.
According to Beringer et al. (2007) the annual fire free NEP at Howard Springs was estimated at ~ 4.3 t C/ha/y, with a range of 3.5 to 5.1 t C/ha/yr across years. They calculated the average annual indirect fire effect as -0.7 t C/ha/yr and estimated average emissions of fine and coarse fuels as -1.6 t C/ha/yr. This allowed an estimate of net biome production of 2.0 t C/ha/y, that is made up of trees (1.2 t C/ha/y) and shrub encroachment (0.5 t C/ha/y).